WEATHER FORECASTS

National Institute of Meteorology and Hydrology


Latest Measurements


Table—measurements


StationDate Hour Temperature
[°C]
WeatherWind speed
[m/s]
Wind directionAir pressure
[hPa]
Novo Selo31.05.20250615cloudy1W1011.3
Vidin31.05.20250614cloudy0тихо1013.6
Vratsa31.05.20250615cloudy1W981.4
Montana31.05.20250614cloudy3SW997
Lom31.05.20250616cloudy0тихо1015.8
Oryahovo31.05.20250616cloudy0тихо1014.8
Knezha31.05.20250613cloudy2W1003.3
Lovech31.05.20250615cloudy2W991.3
Pleven31.05.20250614cloudy2SW998.8
V. Tarnovo31.05.20250614cloudy0тихо994.7
Svishtov31.05.20250615cloudy0тихо1012
Ruse31.05.20250615cloudy0тихо1012.4
Shumen31.05.20250615cloudy3NW992.9
Razgrad31.05.20250613recent rain shower1W977
Silistra31.05.20250616cloudy0тихо1014.9
Silistra-NIMH31.05.20250616cloudy0тихо1014.7
Varna31.05.20250614partly cloudy3NW1011.5
Shabla31.05.20250613clear/sunny5NW1015.7
Kaliakra31.05.20250615clear/sunny4N1008.8
Dobrich31.05.20250613partly cloudy1W993.5
Kyustendil31.05.2025069partly cloudy0тихо957.9
Dragoman31.05.20250611cloudy2NW936.7
Blagoevgrad31.05.20250610cloudy1E968.9
Cherni Vrah31.05.2025062cloudy4N774.5
Sofia31.05.20250612cloudy2W950
Mussala31.05.202506-2clear/sunny8NE716.4
Plovdiv31.05.20250616slight rain shower(s)3SW999.2
Botev31.05.2025062fog8N764.8
Pazardzhik31.05.20250615slight rain shower(s)1W993
Chirpan31.05.20250615cloudy2W996.4
Kazanlak31.05.20250614recent rain shower1N970.8
Stara Zagora31.05.20250614cloudy0тихо997.1
Sliven31.05.20250617cloudy5NW987.1
Elhovo31.05.20250613cloudy0тихо996.3
Karnobat31.05.20250615mostly cloudy0тихо994.9
Emine31.05.20250616clear/sunny7N1008.9
Burgas31.05.20250616mostly cloudy0тихо1013.6
Ahtopol31.05.20250616partly cloudy4NW1015.6
Sandanski31.05.20250614cloudy2W993.8
Gotse Delchev31.05.20250613cloudy1W948.6
Rozhen31.05.2025066fog2N827.4
Kurdzhali31.05.20250615cloudy0тихо979
Haskovo31.05.20250615cloudy2NW990.4
Legend—measurements


Legend—Measurements

 
SymbolWeatherSymbolWeatherSymbolWeather Wind—Symbol m/s km/h Knots
clear/sunnyrecent drizzleheavy drizzle 0 0 0
partly cloudydrizzle and rain; recent rain; slight rain shower(s);moderate rain; 2 7 3
mostly cloudyrecent snow; light snow; snow or crystalsmoderate rain; moderate rain shower(s); 3,5 12 7
visibility reduced by smoke,dust or sand;dust or sand whirl(s);mist;rain and snowheavy rain 5 18 12
duststorm or sandstorm; thick fog;freezing drizzle/rainviolent rain shower(s) 8 28 17
haze; shallow fog;recent snow shower;light snow;rain and snow 10 36 22
lightening(s)recent hail; sleet; hail;heavy snow; snow shower(s) 15 55 32
rain shower, not falling; cloudyblowing snow; moderate snow; snow shower(s);diamond dust,sleet 25 90 52
shower near the stationlight or dissipating fog;heavy rain and snow 30 110 62
squall(s); tornado; recent thunder;light or moderate drizzle;hailstorm 50 180 102

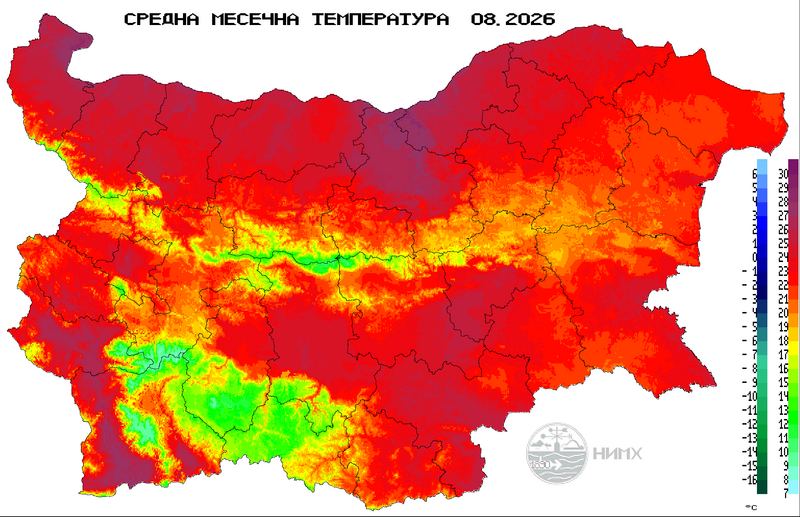
Minimum and Maximum Temperatures

What do you see on the maps with the minimum and maximum temperatures?


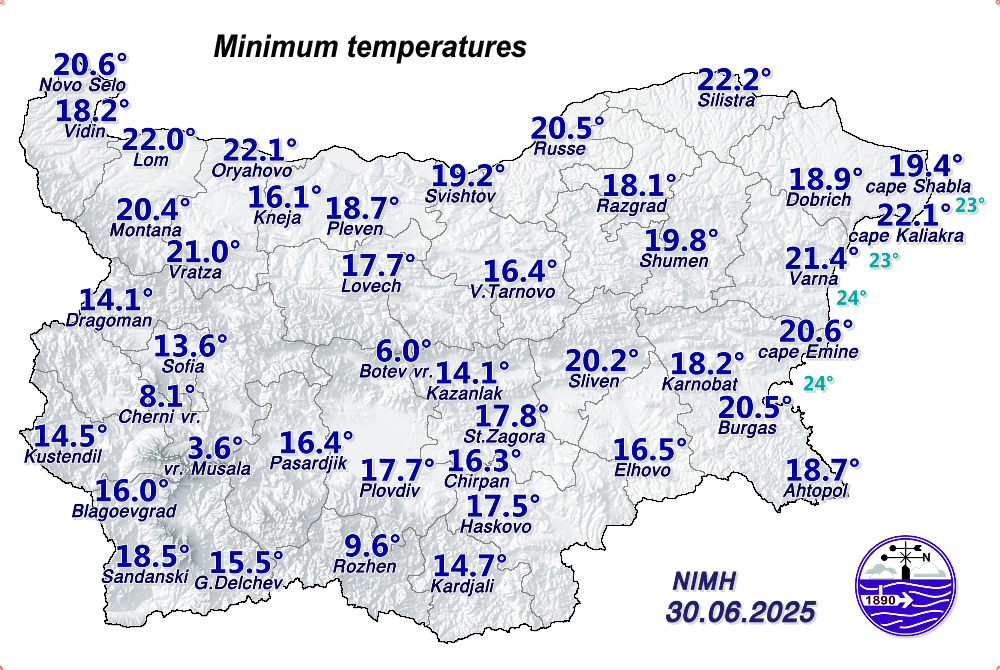
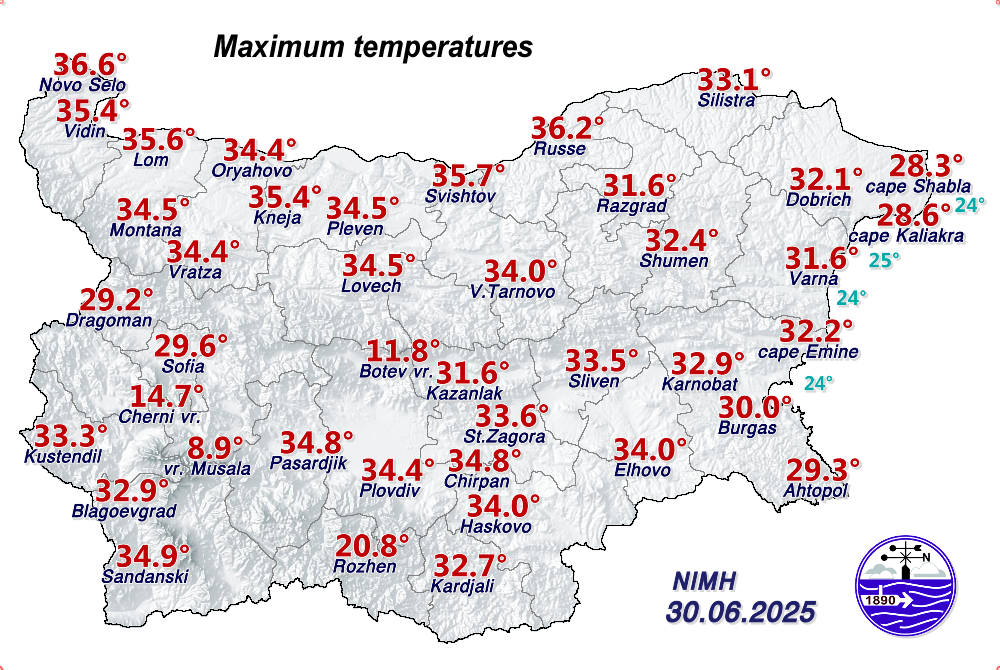
What do you see on the maps with the minimum and maximum temperatures? On the map with the minimum/maximum measured temperatures by synoptic station, you will see one value in degrees Celsius (℃) above the written name of each city that has a NIMH synoptic station. It is the minimum/maximum value recorded by the measurements in the corresponding way for that particular day. At the bottom right of the map is the date to which the corresponding temperature measurements relate.

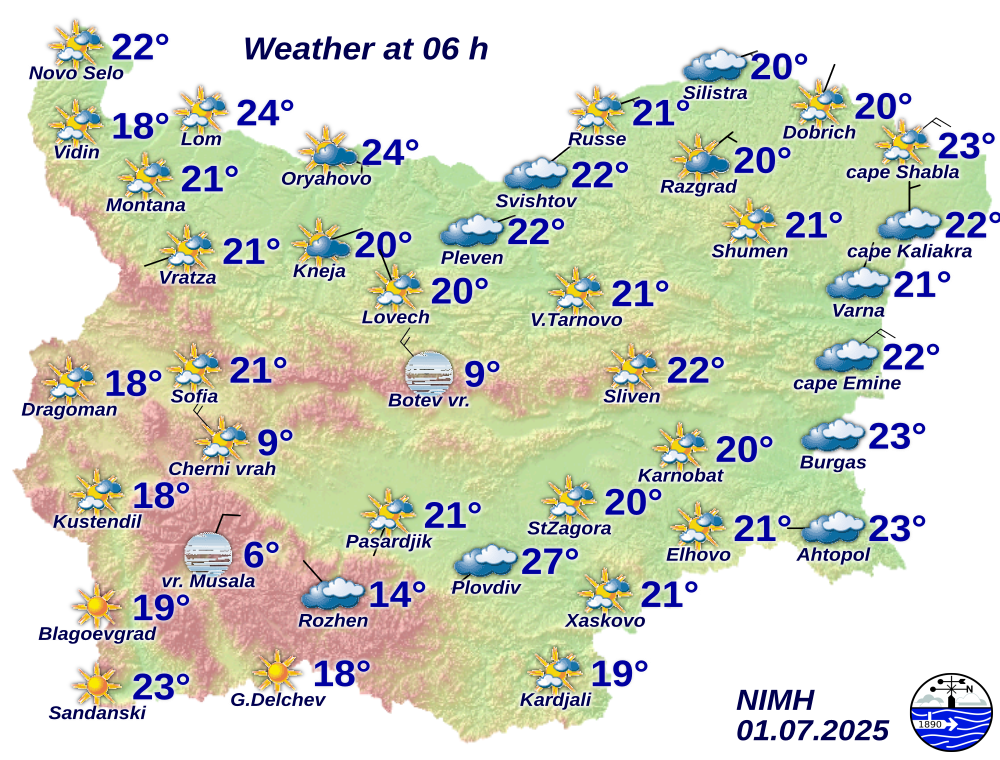
Air temperature: air temperature is a measure of the average thermal energy of ambient air molecules—the higher the temperature, the higher the kinetic energy of the molecules. Historically, the most common instrument used was a glass thermometer with liquid that expands or contracts as a result of heating or cooling. Mercury was the most commonly used. Mercury thermometers are not used in meteorology for almost a decade, as mercury is dangerous if it leaks when the thermometer breaks. In meteorological services around the world, including the National Institute of Meteorology and Hydrology (NIMH), as part of the World Meteorological Organization (WMO), these thermometers have been replaced by those with alcohol-based liquid or digital thermometers. Modern automatic weather stations use an electronic sensor. The measurement accuracy of these sensors depends on the material from which they are made. High accuracy is achieved, for example, with sensors made of platinum. In order to measure the temperature most accurately, the instruments are placed under radiation protection - a meteorological cell of special construction so as to avoid the influence of direct heating from the Sun. The construction of the meteorological cell allows air to pass through it unhindered, it always faces north and is painted white. Combined with the compulsory positioning of the instrument cage 2 metres above the ground on a grassed mown area, avoids a maximum number of disturbances in the measurements and guarantees the reading of the actual air temperature. In NIMH, according to the standard WMO recommendations, the daily maximum (highest) and minimum (lowest) temperature are recorded once a day, at 06 UTC (08:00/09:00 - in winter/summer time in Bulgaria) and at 18 UTC (20:00/21:00 - in winter/summer time in Bulgaria), respectively, while instantaneous air temperature measurements can be made at any time of the day, practically continuously.

How is temperature measured for meteorological purposes? Temperature data before 1910 should be used with extreme caution, as many stations before that date were set up in substandard locations, some of which gave readings that were several degrees higher or lower than those measured according to post-1910 standards. Daily maximum temperatures are usually observed in the afternoon, and daily minimum temperatures at night or around dawn. In clear and calm weather, the temperature minimum is reached around sunrise. That is, the usual diurnal pattern is associated with a minimum in the morning and a maximum after noon. There are also exceptions, which are associated with certain synoptic conditions with cold intrusion, the temperatures have a so-called "reverse diurnal course", which means that it is colder in the afternoon than in the morning.
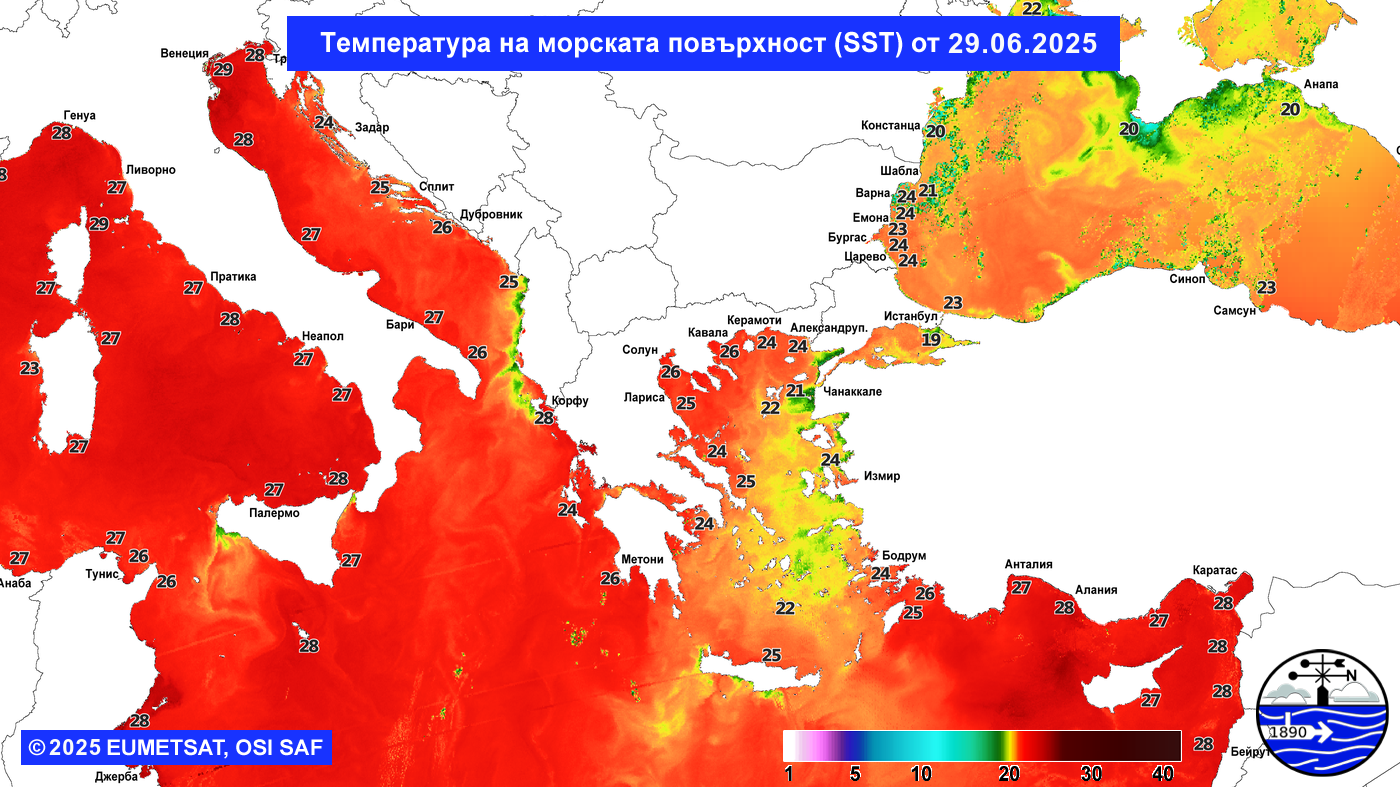
Satellite IR


Cloud Systems
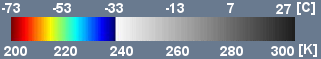
(Temperature of cloud tops or land/sea surface if clouds are missing)

The scale is in Kelvin, dublicated in °C.:

Satellite RGB


Airmasses

Legend—airmasses


Thick high-level clouds
Thick mid-level clouds
Jet stream, high Potential Vorticity (PV)
Cold airmass
Warm airmass – high tropopause
Warm airmass – low tropopause

About Eumetsat


EUMETSAT is the European intergovernmental satellite organisation for monitoring weather, climate and the environment.

EUMETSAT operates and develops the European system of meteorological satellites monitoring the atmosphere and ocean and land surfaces which deliver weather and climate-related satellite data, images and products – 24 hours a day, 365 days a year. This information is supplied to the National Meteorological Services of the organisation's Member and Cooperating States (in Bulgaria—NIMH) as well as other users worldwide.

Bulgaria is a Cooperating State EUMETSAT since May 25, 2005.

24-hour Precipitation Map

24-hour precipitation sum analysis since 8 h local time on 27.06.2023 until 8 h on 28.06.2023, using ALADIN numerical model and measured data from NIMH stations. It is calculated once daily about 12 o'clock. It is produced automatically and may sometimes contain inaccurate data that is corrected later.

Data Map of Precipitation
Table with Data of Precipitation in 166 NIMH Stations

Snow Cover

Snow depth from NIMH stations at 7h 30min on the date, given on the map. Calculated once a day at about noon. Left scale — snow depth in centimeters. Right scale — altitude in meters for places without snow.

Notice: This is an operational map and is only suitable as a guide to the general state of snow cover in the country. It contains inherent imperfections as a result of modelling methods and operational data transmission.

Data Map of Snow Cover
Table with Data of Snow Cover in 166 NIMH Stations
NIMH Sofia

Daily Data for the Snow Cover in 166 NIMH Stations
за 30.05.2025

No Station Type Precipitation
Quantity [mm*10] Type Snow Cover [cm]
1010 NovoSelo climatic dew
1020 Vidin climatic no precipitation
1030 Gramada climatic no precipitation
1040 Belogradchik climatic no precipitation
1460 Kula precipitation
2015 Montana climatic 30 rain shower
2020 D-rIosifovo climatic
2030 Varshets climatic 26 rain
2050 Bazovets climatic
2060 Lom climatic no precipitation
2401 Chiprovtsi precipitation 2 rain
2430 Berkovitsa precipitation 21 rain
3010 Vratca climatic no precipitation
3040 Kneja climatic 35 rain
3050 Oriahovo climatic 28 rain shower
3401 ByalaSlatina precipitation 2 rain
3440 Borovan precipitation
3530 Roman precipitation
4010 Pleven climatic no precipitation
4020 Somovit climatic
4040 Novachene climatic 0 rain
4060 Nikolaevo climatic 8 rain
4430 Pordim precipitation
4500 Orehovitsa precipitation
4590 Levski precipitation 4 rain
5010 Lovech climatic 16 rain shower
5020 Borima climatic 10 rain shower
5030 Teteven climatic 5 rain
5040 Troyan climatic
5080 Dermantsi climatic no precipitation
5401 Lukovit precipitation 26 rain
5460 Ribaritsa precipitation 20 rain
5490 Chiflik precipitation 21 rain
5510 CherniOsam precipitation 31 rain
5520 Apriltsi precipitation 45 rain
6010 Sevlievo climatic 12 rain
6020 Gabrovo climatic 4 rain
6470 Tryavna precipitation
7010 VelikoTarnovo climatic dew
7020 Pavlikeni climatic 20 rain
7040 Elena climatic dew
7440 Kostel precipitation 8 rain
7470 Kesarevo precipitation 53 rain
7580 PolskiTrambesh precipitation 49 rain
21010 RuseUPPD climatic 66
21020 DveMogili climatic 130 rain
21030 ObraztsovChifli climatic 78 rain
22010 Targovishte climatic 30 rain
22020 Omurtag climatic 32 rain
22030 Slavyanovo climatic 87 rain
22480 VraniKon precipitation
22520 Nadarevo precipitation 118 rain
23010 Razgrad climatic 26 rain shower
23020 Samuil climatic
23030 Isperih climatic 6 rain
23480 TSarKaloyan precipitation 59 rain
23490 Kubrat precipitation 42 rain
24010 SilistraUPPD climatic 43
24020 Alfatar climatic dew
24030 Glavinitsa climatic 2 rain
24430 Tutrakan precipitation 43 rain
25010 Shumen climatic 21 rain shower
25040 TSarevBrod climatic
25401 Preslav precipitation 2 rain
25410 NoviPazar precipitation
25420 Varbitsa precipitation
25500 Rish precipitation
26010 Dobrich climatic 2 rain shower
26020 Shabla climatic 13 rain
26030 Kaliakra climatic no precipitation
26060 Krushari climatic no precipitation
26080 GeneralToshevo climatic
26630 Obrochishte precipitation
27010 Varna climatic 8 rain shower
27020 StaroOryahovo climatic
27030 GorenChiflik climatic 89 rain
27050 Suvorovo climatic 102 rain
27070 Dalgopol climatic no precipitation
27460 Beloslav precipitation
27490 NovaShipka precipitation 43 rain
28010 Burgas climatic 4 rain shower
28021 Ahtopol climatic dew
28040 Karnobat climatic 34 rain shower
28045 Sungurlare climatic dew
28050 Liulyakovo climatic no precipitation
28060 Grudovo climatic 0 rain
28120 Rezovo climatic
28150 MalkoTarnovo climatic 31 rain
28510 Veselie precipitation
28550 Kosti precipitation 3 rain
28610 Fakiya precipitation 2 rain
28630 Zidarovo precipitation
29010 Yambol climatic dew
29020 Elhovo climatic dew
29060 Topolovgrad climatic dew
29465 Strandzha precipitation 42 rain
41010 Sliven climatic no precipitation
41030 Sadievo climatic
41040 Kotel climatic 18 rain
41430 ZlatiVoivoda precipitation
41530 Gradets precipitation
42010 StaraZagora-Ins climatic no precipitation
42020 Chirpan climatic dew
42030 Kazanlak climatic dew
42042 Radnevo climatic
42420 Dalboki precipitation
42450 Pchelinovo precipitation
42470 Shipka precipitation 4
43010 Haskovo climatic dew
43040 lubimetc climatic no precipitation
43420 Simeonovgrad precipitation
43520 TSarevaPolyana precipitation
44010 Kardjali climatic no precipitation
44020 Dzhebel climatic dew
44030 Krumovgrad climatic 12 rain
44040 Ivailovgrad climatic no precipitation
44540 Ardino precipitation
44470 Momchilgrad precipitation
44510 Kirkovo precipitation 6 rain
45030 Chepelare climatic no precipitation
45040 Raikovo climatic dew
45070 Zlatograd climatic no precipitation
45120 Rozhen climatic dew
45130 Devin climatic dew
45450 Mugla precipitation
45480 Barutin precipitation 11 rain
45530 Manastir precipitation
45541 Mihalkovo precipitation
46011 Plovdiv climatic no precipitation
46020 Sadovo climatic no precipitation
46030 Asenovgrad climatic no precipitation
46060 Karlovo climatic
46090 vr.Botev climatic 29
46440 Parvomai precipitation
46680 Svezhen precipitation
46760 Klisura precipitation 1 rain
47010 Pazardjik climatic no precipitation
47040 Velingrad climatic
47050 Panagiurishte climatic no precipitation
47070 Peshtera climatic no precipitation
47570 Batak precipitation 20 rain
47590 Fotinovo precipitation
47640 Sarnitsa precipitation 8 rain
61010 Blagoevgrad climatic dew
61040 Bansko climatic 2 rain
61100 Sandanski climatic no precipitation
61111 Purvomai climatic 39 rain
61420 Yakoruda precipitation
61570 Satovcha precipitation
61600 Gaitaninovo precipitation 17
61631 Polena precipitation
61695 s.Pirin precipitation 7 rain
62010 Kustendil climatic 11 rain shower
62050 Dupnitsa climatic 4 rain
63010 Pernik climatic no precipitation
63406 Chuipetlovo precipitation 3 rain
64132 Zlatitsa climatic 11 rain
64201 Sofia climatic 0 rain
64205 CherniVrah climatic no precipitation
64210 vr.Mourgash climatic
64215 vr.Musala climatic 24 snow shower
64235 Samokov climatic 10 rain
64305 Bozhurishte climatic no precipitation
64310 Dragoman climatic 3 rain shower
64315 Bankya climatic
64420 Etropole precipitation 43 rain

Legend

The table gives data on the amount of precipitation in "lines" (tenths of a millimeter or tenths of a liter per square meter) in the left column, on the type of precipitation - in the middle column, and on the presence of snow cover and its height (in centimeters) – in the right column. When there is no number in the left data column, there is no precipitation. Climate stations report precipitation data every day. In case there is no information for a given date, n.a. is written in the middle column. Since 2021, the network of rain gauge stations at NIMH has been equipped with automated devices for real-time rainfall measurement, but the rain gauge stations continue to provide operational information of the 24-hour rainfall amount in the classic way once a day. Traditionally, it is only reported for days with measured precipitation ≥ 0.5 mm, but it is possible to have days with information for precipitation < 0.5 mm, and this is not wrong. For these stations, it is possible that there are days when there is precipitation, but no information is reported. For this type of station, an empty field means that no information has been received for the corresponding date. Also for this type of station information n.a. in all three columns means that wrong information has been received for that date and has been corrected.

Legend 1: Special symbols for the snow cover in the right field.
SymbolSnow Cover
p%Non less than the half of land surface, where N is mean snow cover in cm, when it is <10 cm, or N=A, when it is >=10cm
P%Non more than the half of land surface, where N is mean snow cover in cm, when it is <10 cm, or N=A, when it is >=10cm
n.aspots of snow; the height cannot be measured
errerror
Note 1: Data are operational. Errors are possible. To be used for decision making only after consultation with the weather forecaster on duty.
Note 2: At Moussala - a mountain station - snow cover is not measured.

Lightening Detection over Bulgaria

UTC - Summer daylight saving time in Bulgaria is UTC+3, in Winter the local time is UTC+2

Hourly (in UTC) and space distribution of lightenings registerred over Bulgaria during the last day - from 0h to 24h

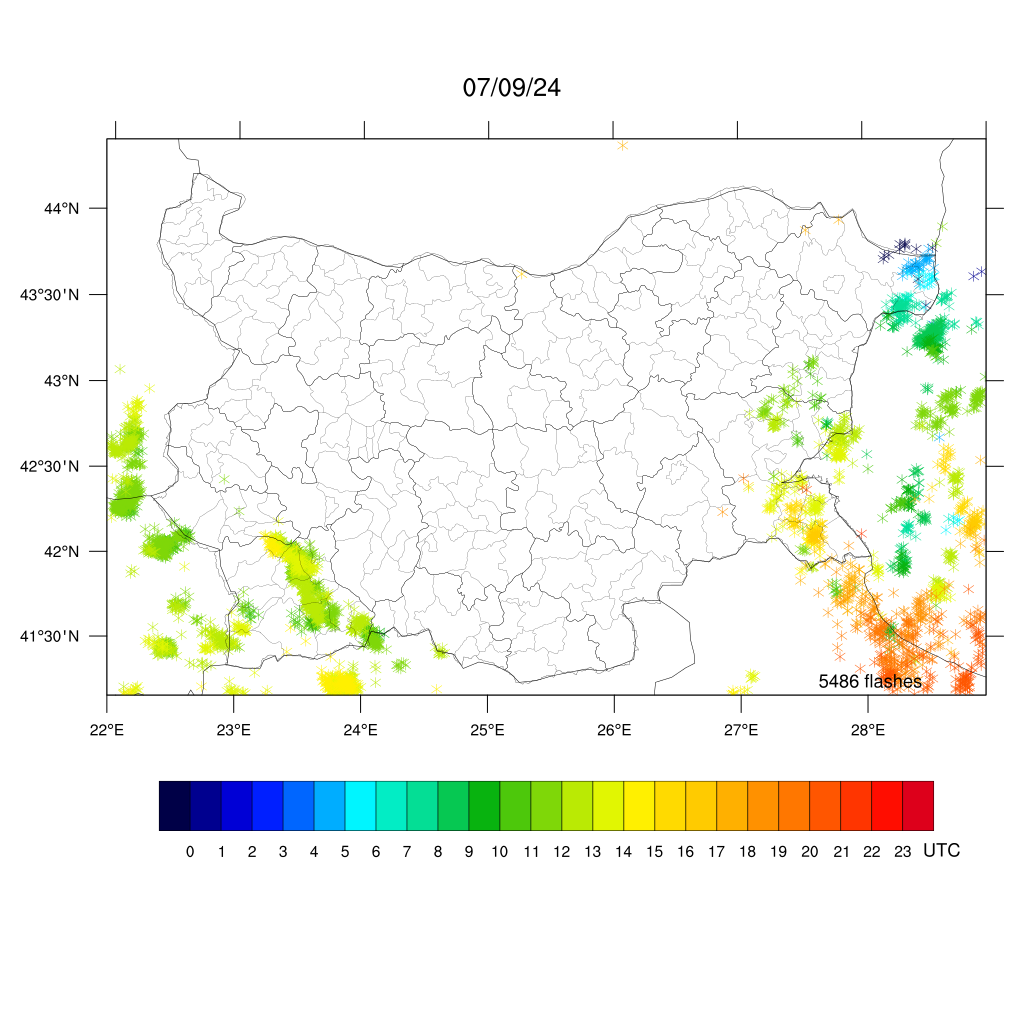
Hourly (in UTC) and space distribution of lightenings registerred over Bulgaria today (updated hourly)

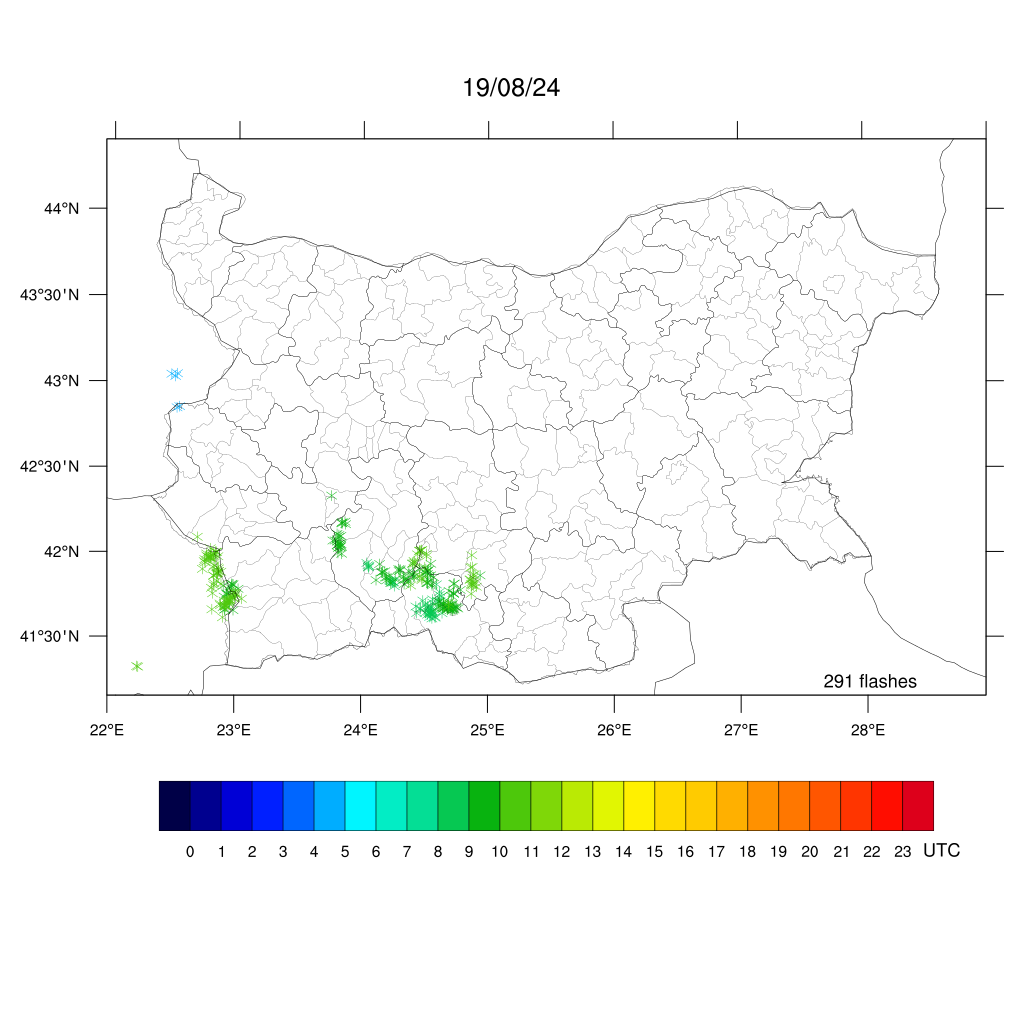
The system LEELA (Lightning Electromagnetic Emission Location by Arrival time difference) LEELA (Lightning Electromagnetic Emission Location by Arrival time difference) of the British Met Office is the new automatic lightning detection network. It consists of ten sensors deployed across Europe to determine the location and timing of recorded lightnings.

Ground Surface Temperature at NIMH Synoptic Stations

The maps are based on an operational objective analysis of data from the NIMH synoptic stations.

Note: Data are operational. Errors are possible. To be used for decision making only after consultation with the weather forecaster on duty.

Table of ground surface temperature at our synoptic stations

Ground Surface Temperature at Our Synoptic Stations on 31.05.2025 at 03 h (UTC)

The data are from the last observation in the Bulgarian weather stations.

Time in Bulgaria is UTC+2 h in Winter and UTC+3 h in Summer.

StationAir temperature at 2 m height
[°C]
Relative humidity
[%]
Wind-speed
[m/s]
Clouds
[tenths]
Ground surface temperature
[°C]
Novo Selo 15.3 72 1. 8. 14.0
Vidin 14.2 80 0. 6. 12.0
Vratsa 15.0 66 1. 8. 13.4
Montana 13.5 80 3. 8. 12.7
Lom 16.4 69 0. 6. 13.8
Oryahovo 15.6 87 0. 8. 14.2
Knezha 12.8 91 2. 9. 12.3
Lovech 15.0 73 2. 9. 14.2
Pleven 14.1 83 2. 8. 13.1
V. Tarnovo 14.2 94 0. 8. 12.9
Svishtov 15.2 89 0. 10. 15.1
Ruse 14.6 94 0. 6. 12.6
Shumen 15.4 85 3. 9. 14.9
Razgrad 13.3 97 1. 9. 12.7
Silistra 16.4 85 0. 8. 15.0
Silistra-NIMH 16.3 82 0. 8. 14.9
Varna 14.3 87 3. 4. 12.7
Shabla 13.3 89 5. 0. 12.2
Kaliakra 14.6 81 4. 0. 13.2
Dobrich 12.5 94 1. 3. 10.4
Murgash 6.3 92 4. 5. 5.0
Kyustendil 8.9 97 0. 4. 6.4
Dragoman 10.6 83 2. 9. 9.9
Blagoevgrad 10.4 95 1. 6. 9.0
Cherni Vrah 1.5 96 4. 9. 0.9
Sofia 11.5 83 2. 6. 9.8
Mussala -2.2 93 8. 6. -3.0
Plovdiv 15.8 89 3. 10. 15.7
Botev 1.5 100 8. 10. 1.3
Pazardzhik 14.7 86 1. 10. 14.5
Chirpan 14.9 96 2. 9. 14.4
Stara Zagora 14.2 90 0. 6. 12.0
Sliven 16.6 84 5. 6. 15.8
Elhovo 12.9 96 0. 8. 11.8
Karnobat 14.5 89 0. 5. 12.0
Emine 15.5 85 7. 0. 14.7
Burgas 15.6 90 0. 4. 13.0
Ahtopol 16.0 84 4. 5. 15.0
Sandanski 13.7 80 2. 8. 12.9
Gotse Delchev 12.8 82 1. 8. 11.5
Rozhen 5.9 97 2. 9. 4.9
Kurdzhali 15.4 76 0. 10. 14.9
Haskovo 15.2 88 2. 7. 13.8
Ground Surface Temperature

The ground surface temperature (also called “skin” temperature) is calculated for a grassy horizontal, flat ground surface outdoors with no horizon limitation. This is the temperature of the upper effective boundary of the grass or the exposed surface of the snow cover, if any. It is assumed that the grass surface is maintained in accordance with the recommendations of the World Meteorological Organization for the arrangement of a park for conducting meteorological measurements. It should be mowed at a height of several centimeters above the soil surface.

The temperature at a height of 5 cm above the soil surface is the closest temperature measured at a standard level to correspond to the temperature of the grassed ground surface.

The “skin” temperature is determined with a numerical thermal balance model constructed to use standard data of meteorological parameters: temperature and relative humidity of the air at a height of 2 m, wind speed at 10 m, amount of cloudiness, geographical location, date and time for solar radiation.

The sunlit land surface temperature can be much higher than the air temperature at 2 m, while the nighttime land surface temperature can be much lower in cloudless, dry and calm weather.

Preparedness for Firefighting

Legend—fire risk
Степен на риск/ HazardОписание на българскиDescription in English
Малък
Low
Съществуващи пожари се самозагасяват и е малко вероятно да възникват нови. Жизнени пожари са възможни само като тлеене в дълбоки сухи слоеве.Fires likely to be self-extinguishing and new ignitions unlikely. Any existing fires limited to smoldering in deep, drier layers.
Умерен
Moderate
Възможни са леки и бавно развиващи се пожари. Съществуващи пожари се гасят лесно от наземни екипи с помпи и ръчни инструменти.Creeping or gentle surface fires. Fires easily contained by ground crews with pumps and hand tools.
Голям
High
Възможни са умерени до силни пожари с въвличане на дървесни корони само локално. Пожарите са трудни за овладяване от наземни екипи. Често се налага използване на тежка екипировка за овладяване на пожарите (булдозери, камиони-цистерни, самолети).Moderate to vigorous surface fire with intermittent crown involvement. Challenging for ground crews to handle; heavy equipment (bulldozers, tanker trucks, aircraft) often required to contain fire.
Много голям
Very High
Възможни са много силни пожари с частично или пълно въвличане на дървесните корони. Предните фронтове на пожарите е невъзможно да бъдат овладени от наземни екипи. Налагат се въздушни атаки със забавящ агент (retardant), за да се атакуват успешно предните фронтове на пожарите.High-intensity fire with partial to full crown involvement. Head fire conditions beyond the ability of ground crews; air attack with retardant required to effectively attack fire's head.
Екстремален
Extreme
Възможни са бързо разпространяващи се много силни пожари с въвличане на дървесните корони. Пожарите са трудни за овладяване. Действията по погасяване се ограничени само по фланговете на пожара. Възможни са само индиректни действия, насочени срещу предните фронтове на пожарите.Fast-spreading, high-intensity crown fire. Very difficult to control. Suppression actions limited to flanks, with only indirect actions possible against the fire's head.
Не се пресмята (сняг)
(Snow)
Не се извършват изчисления за този район. (Наличие на снежна покривка).No calculations were performed for this region.

Източник: Canadian Forest Service (http://cfs.nrcan.gc.ca/)

More about the Canadian Fire Weather Index


The system is operational since April,2008 during the warm months (April-October)The Canadian Fire Weather Index, FWI, developed in the Canadian Forest Service Research Center is used.

Data used (input elements for FWI calculation):

  • precipitaion amount for the last 24 hours;
  • air temperature;
  • air relative humidity;
  • wind speed; snow cover presence;
  • day duration.

FWI has three sub-indices showing the "dryness" of different types of "fuel". Each of these sub-idices is a complex function of the meteo-elements. Knowing the sub-indices and wind velocity data, two other sub indices are calculated, which evaluate the initial fire kindling and the available "fuel" for the further unfolding of the fire. On their basis the FWI in calculated and it gives an overall assessment of the intensity of fire unfolding (in energy released per unit time per unit length along the fire front line).

Thermal Comfort/Discomfort Analysis for the Last Synoptic Term

The maps are based on an operational objective analysis of data from the NIMH synoptic stations.

Note: Data are operational. Errors are possible. To be used for decision making only after consultation with the weather forecaster on duty.

Table of Feels Like Temperatures at Our Synoptic Stations

Thermal Comfort Index in Our Weather Stations on 31.05.2025 в 03 UTC

The data are from the last observation in the Bulgarian weather stations.

Time in Bulgaria is UTC+2 h in Winter and UTC+3 h in Summer.

StationMeasuredCalculated
Temperature
[°C]
Relative humidity
[%]
Wind speed
[m/s]
Clouds
[tenths]
Feels like temperature
[°C]
Comfort indexProposed clothing
Novo Selo 15.3 72 1. 8. 11.8 8 0.90
Vidin 14.2 80 0. 6. 11.0 8 0.94
Vratsa 15.0 66 1. 8. 11.0 8 0.94
Montana 13.5 80 3. 8. 8.6 7 1.07
Lom 16.4 69 0. 6. 13.4 8 0.81
Oryahovo 15.6 87 0. 8. 13.8 8 0.79
Knezha 12.8 91 2. 9. 9.4 7 1.02
Lovech 15.0 73 2. 9. 11.0 8 0.94
Pleven 14.1 83 2. 8. 10.2 8 0.98
V. Tarnovo 14.2 94 0. 8. 12.6 8 0.85
Svishtov 15.2 89 0. 10. 15.0 8 0.73
Ruse 14.6 94 0. 6. 11.8 8 0.90
Shumen 15.4 85 3. 9. 11.0 8 0.94
Razgrad 13.3 97 1. 9. 11.0 8 0.94
Silistra 16.4 85 0. 8. 14.6 8 0.75
Silistra-NIMH 16.3 82 0. 8. 14.2 8 0.77
Varna 14.3 87 3. 4. 9.4 7 1.02
Shabla 13.3 89 5. 0. 7.8 7 1.11
Kaliakra 14.6 81 4. 0. 8.6 7 1.07
Dobrich 12.5 94 1. 3. 8.6 7 1.07
Murgash 6.3 92 4. 5. 0.1 7 1.51
Kyustendil 8.9 97 0. 4. 5.3 7 1.23
Dragoman 10.6 83 2. 9. 7.0 7 1.15
Blagoevgrad 10.4 95 1. 6. 5.3 7 1.23
Cherni Vrah 1.5 96 4. 9. -6.1 6 1.83
Sofia 11.5 83 2. 6. 7.0 7 1.15
Mussala -2.2 93 8. 6. -13.0 5 2.20
Plovdiv 15.8 89 3. 10. 11.0 8 0.94
Botev 1.5 100 8. 10. -6.7 6 1.87
Pazardzhik 14.7 86 1. 10. 11.0 8 0.94
Chirpan 14.9 96 2. 9. 11.4 8 0.92
Stara Zagora 14.2 90 0. 6. 11.8 8 0.90
Sliven 16.6 84 5. 6. 10.6 8 0.96
Elhovo 12.9 96 0. 8. 11.0 8 0.94
Karnobat 14.5 89 0. 5. 11.8 8 0.90
Emine 15.5 85 7. 0. 9.4 7 1.02
Burgas 15.6 90 0. 4. 12.6 8 0.85
Ahtopol 16.0 84 4. 5. 10.2 8 0.98
Sandanski 13.7 80 2. 8. 8.6 7 1.07
Gotse Delchev 12.8 82 1. 8. 9.4 7 1.02
Rozhen 5.9 97 2. 9. 2.6 7 1.38
Kurdzhali 15.4 76 0. 10. 15.0 8 0.73
Haskovo 15.2 88 2. 7. 11.0 8 0.94
Thermal Comfort/Discomfort on the Bases of Feels Like Temperature

The proposed maps show the current or expected feeling of thermal comfort/discomfort of the majority of people. The maps refer to a standard time of day, which corresponds to the classical observation periods at weather stations. For example, 12 UTC (Coordinated Universal Time) corresponds to 14:00 Bulgarian time (15:00 summer time), which is usually close to the warmest hours of the day, and 03 UTC corresponds to 05:00 Bulgarian time (06:00 summer weather) which is usually close to the coldest hours of the day.

Thermal Comfort Classes, Description of the Sensation of Comfort/Discomfort and Recommended Clothing

The table shows the degrees of thermal comfort/discomfort. The categories of comfortable, warm and hot are defined on the basis of the degrees of physiological stress to which the human thermoregulatory system is subjected in the different temperature conditions according to the feels like temperature. The categories for cold are according to the Wind Chill Index.

Thermal comfort class From feels like temperature, °С To feels like temperature, °С Grade in colour Thermal sensation of comfort or discomfort Description Level of clothing
13 44 - Extreme heat Substantial risk of thermal shock in prolonged work/stay outdoors. 0.4
12 38 44 Very hot The mechanism of self-cooling by sweating is hindered. 0.4
11 32 38 Hot Almost the whole body is covered in sweat. 0.4
10 26 32 Very warm A big part of the body is covered with sweat. 0.4
9 20 26 Warm Sweating has started. A small part of the body is covered with sweat. 0.5-0.4
8 10 20 Comfortable Sensation of thermal comfort with suitable clothing 1.0-0.5
7 0 10 Cool Thermal comfort can be achieved with suitable clothing, but there is slight discomfort in the cold side on exposed parts of the body. 1.5-1.0
6 -10 0 Cold Goosebumps start. 2.0-1.5
5 -18 -10 Very cold Shivering starts. 2.4-2.0
4 -27 -18 Possible frost bite Possible frost bite of bare skin 2.9-2.4
3 -35 -27 Frost bite of bare skin Frost bite of bare skin within 30 min of exposure 3.3-2.9
2 -47 -35 Rapid frost bite of bare skin Frost bite of bare skin within 10 min of exposure 3.9-3.3
1 - -47 Dangerously rapid frost bite Dangerously rapid frost bite with 5 min of exposure 4.0

Clothing Index—Meaning

Recommended clothing ensembleClothing index
Nude 0
Shorts0.1
Shorts, open-neck shirt with short sleeves, sandals0.35
Long light-weight trousers, open-neck shirt with short sleeves, open shoes0.5
Long trousers, open-neck cotton work shirt with long sleeves, shoes0.7
Long trousers, cotton work shirt with long sleeves, shoes, and a light jacket0.9
Typical business suit (long trousers, cotton work shirt with long sleeves, vest, shoes, and a jacket)1.0
Typical business suit and a cotton coat1.5
Long resistant trousers, woolen flannel shirt, woolen socks, shoes, wind and water resistant jacket and vest, a hat and gloves1.5-2.0
Polar weather suit with hood, warmth-keeping shoes, a hat covering the ears, strong isolating gloves3.0-4.0

Felt Temperature

Felt temperature is air temperature in a reference atmospheric environment where a person's sense of thermal comfort/discomfort would be the same as in real weather conditions. The feeling of thermal comfort is calculated using a full numerical model of thermal balance of the body of a "standard" human placed in atmospheric conditions near ground, outdoors, on grass or snow cover, if available. The feeling of thermal comfort/discomfort depends on the morphological parameters of the person - age, sex, height, weight and others, but for general purposes, the parameters of a "standard" person are used here. This is a 35-year-old man, 1.75 m tall, weighing 75 kg, in good health. The felt temperature depends on the work performed by the person and can be calculated at different power. In this case, it is assumed that the "standard" person performs work with applying the power corresponding to walking at a speed of 4 km/h on a horizontal surface. It is assumed that the wind always blows to the side of the direction of walking. The clothing is adapted (summer/winter) so that the "standard" person, if possible, achieves thermal comfort in the specific outdoor weather conditions. To determine the felt temperature, data on meteorological elements in the layer of air near the earth's surface (0–2 m), where the "standard" person is located, are used: air temperature; relative air humidity; wind speed; presence of snow cover. Also used: amount of cloud cover; geographical coordinates and altitude of the place; date and time.

Maps—Analysis of the Current Month until Today

Mean monthly temperature (°С), May until today

Mean monthly temperature deviation from norm (°С), May until today

Monthly precipitation sums in mm (l/m2), May until today

Seasonal precipitation sums in % from the norm, May until today

Sea Surface Temperature (SST)


A big map of SST, covering all the Mediterranean and Black Sea (4800х2700 pixels, in new windows)