WEATHER FORECASTS
National Institute of Meteorology and Hydrology


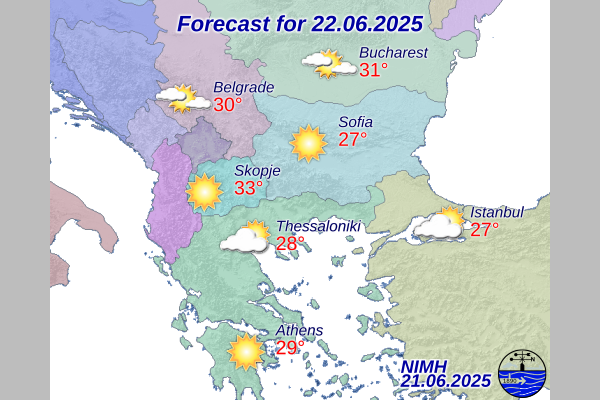
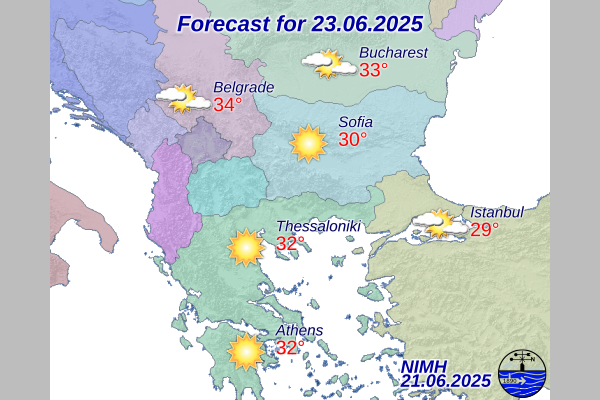
Forecast for the Balkans

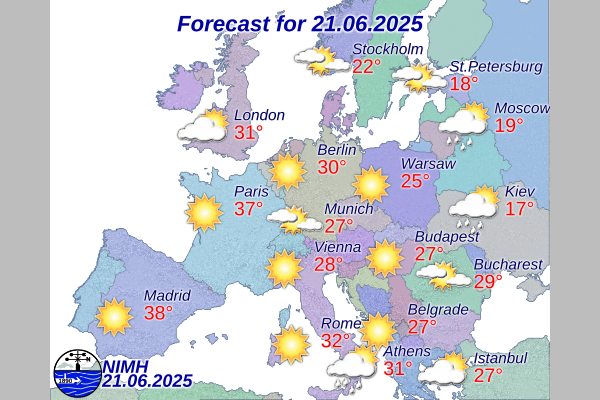
Forecast for Europe
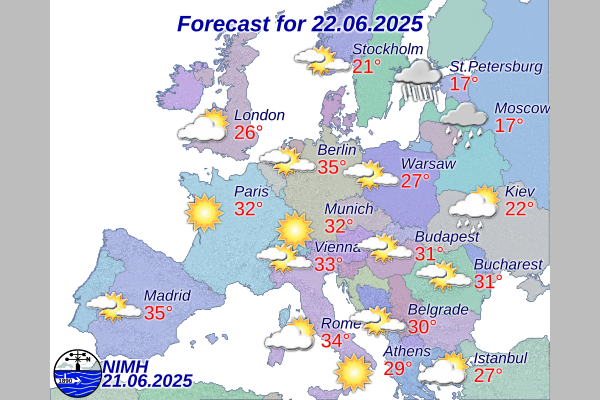
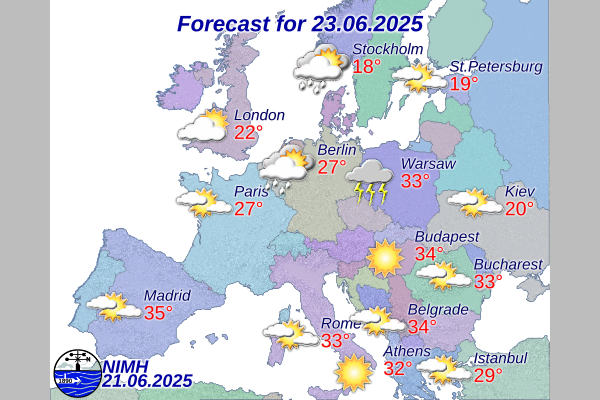
Forecast for some European Cities
| City | 18.06.2026 | 19.06.2026 | 20.06.2026 | |||
|---|---|---|---|---|---|---|
| tmin / tmax [°C] | Weather | tmin / tmax [°C] | Weather | tmin / tmax [°C] | Weather | |
| London | 17 / 27 |  Variable clouds Variable clouds |
18 / 29 |  Sunny Sunny |
18 / 26 |  Mostly cloudy Mostly cloudy |
| Paris | 21 / 37 |  Sun, cloud, shower, and thunder Sun, cloud, shower, and thunder |
25 / 38 |  Mostly sunny Mostly sunny |
23 / 35 |  Thunderstorms Thunderstorms |
| Brussels | 18 / 30 | Variable clouds |
22 / 34 | Sun, cloud, shower, and thunder |
22 / 29 | Mostly sunny |
| Madrid | 21 / 35 | Mostly sunny |
23 / 36 | Mostly sunny |
22 / 37 |  Variable clouds, possible rain Variable clouds, possible rain |
| Stockholm | 15 / 20 |  Mostly cloudy with rain Mostly cloudy with rain |
15 / 25 | Variable clouds |
17 / 25 | Variable clouds |
| Berlin | 16 / 28 | Mostly cloudy |
18 / 33 | Variable clouds |
21 / 34 | Mostly sunny |
| Warsaw | 10 / 24 | Variable clouds, possible rain |
15 / 25 | Variable clouds |
16 / 30 | Mostly sunny |
| Rome | 24 / 35 | Mostly sunny |
24 / 35 | Sunny |
24 / 37 | Mostly sunny |
| Prague | 16 / 29 | Mostly cloudy |
18 / 33 | Sunny |
20 / 35 | Thunderstorms |
| Budapest | 15 / 30 | Variable clouds |
18 / 34 | Sunny |
20 / 35 | Sunny |
| Kiev | 12 / 23 | Mostly cloudy |
14 / 26 | Variable clouds, possible rain |
16 / 26 | Mostly sunny |
| Moscow | 13 / 16 | Mostly cloudy with rain |
13 / 22 | Sun, cloud, shower, and thunder |
||
| Belgrade | 19 / 28 | Variable clouds, possible rain |
18 / 31 | Sunny |
20 / 33 | Mostly sunny |
| Bucharest | 17 / 27 | Variable clouds, possible rain |
16 / 30 | Mostly sunny |
17 / 32 | Mostly sunny |
| Thessaloniki | 20 / 32 | Variable clouds |
20 / 27 | Variable clouds, possible rain |
19 / 29 | Sunny |
| Athens | 21 / 31 | Variable clouds |
21 / 30 | Sunny |
20 / 30 | Sunny |
| Istanbul | 19 / 26 | Variable clouds |
19 / 25 | Variable clouds |
19 / 26 | Variable clouds |
| Ankara | 15 / 31 | Sun, cloud, shower, and thunder |
15 / 23 | Variable clouds, possible rain |
13 / 24 | Variable clouds |
NIMH Products based on the GFS model of NCEP-NOAA
GFS - 7-day Forecast:
Wind
Temperature field at 850 hPa isobaric height
Forecast start time: top left, forecast period: top right, end time: +118
Animated information from NOAA's Global Forecasting System on the expected air temperature at an altitude of about 1500 m.
During the cold half of the year a light blue line plots the minus 5°C isotherm. North of this line, precipitation is very likely to be snow, south of it, rain.
In the warm half of the year a red line draws the plus 20°C isotherm. South of it it gets hot during the day with temperatures above 35°C.
Cold air masses are represented by colours from blue to purple, and warm air masses—by colours from yellow to red.
The coastlines and borders of Bulgaria are represented by a black outline.