WEATHER FORECASTS
National Institute of Meteorology and Hydrology


Maps-analysis for the current month until today
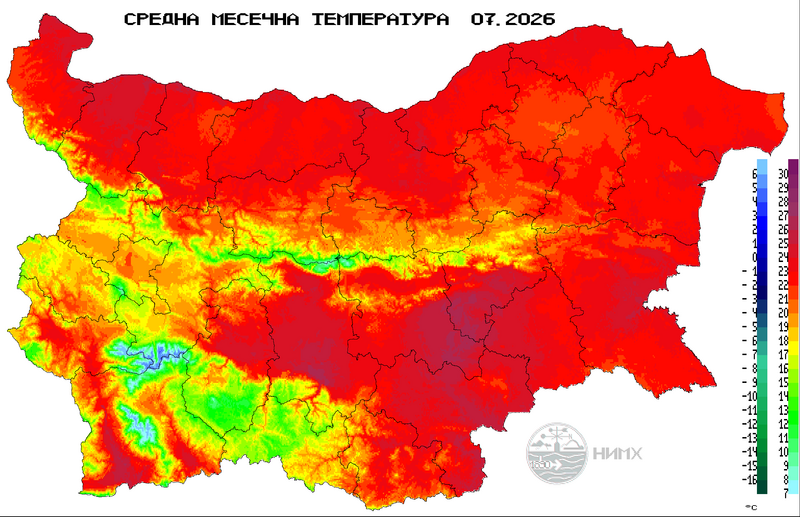
Mean monthly temperature (°С), July until today
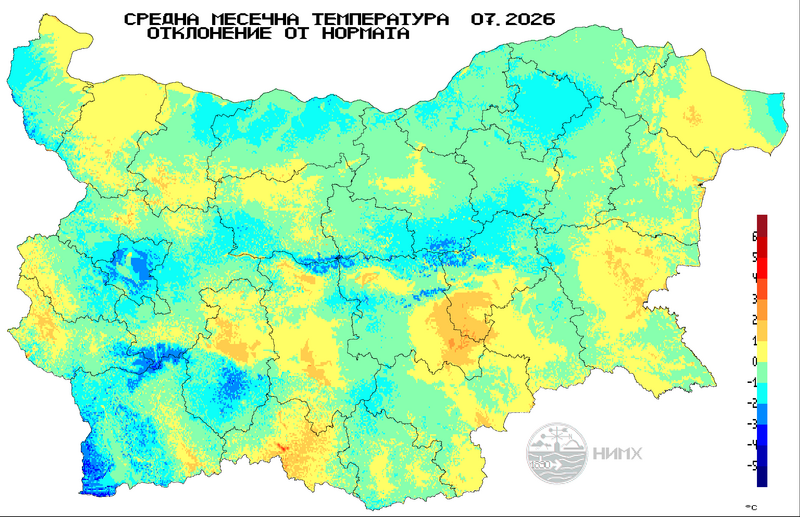
Mean monthly temperature deviation from norm (°С), July until today
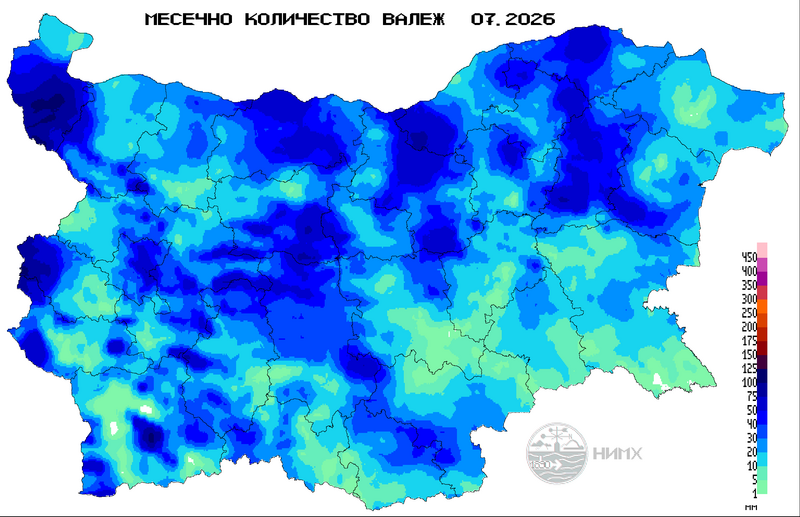
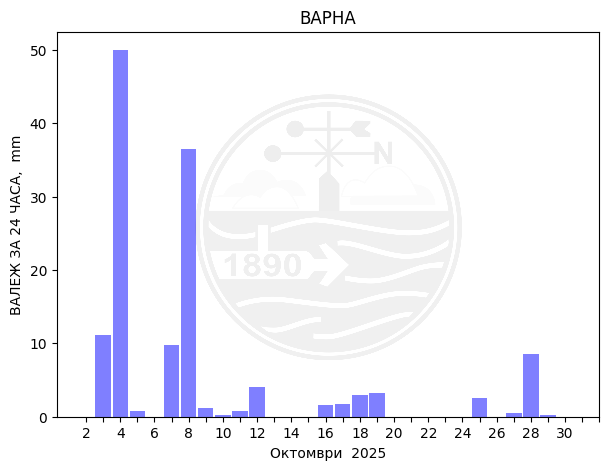
Monthly precipitation sums in mm (l/m2), July until today
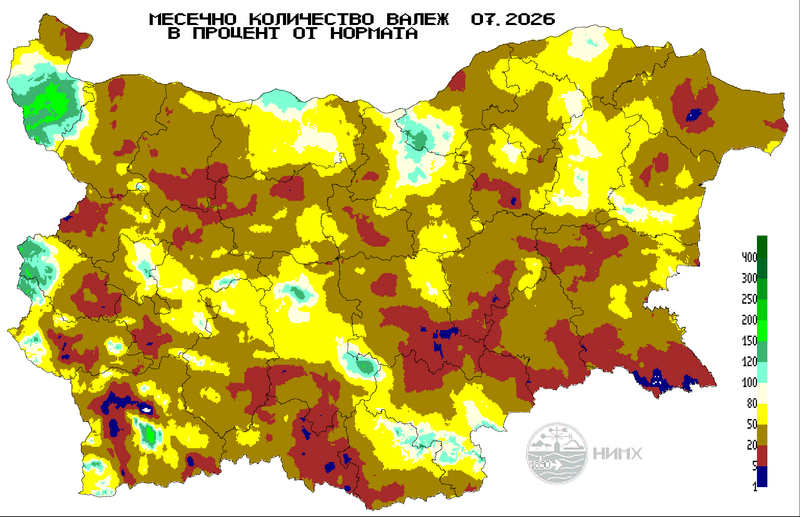
Monthly precipitation sums in % from norm,July until today
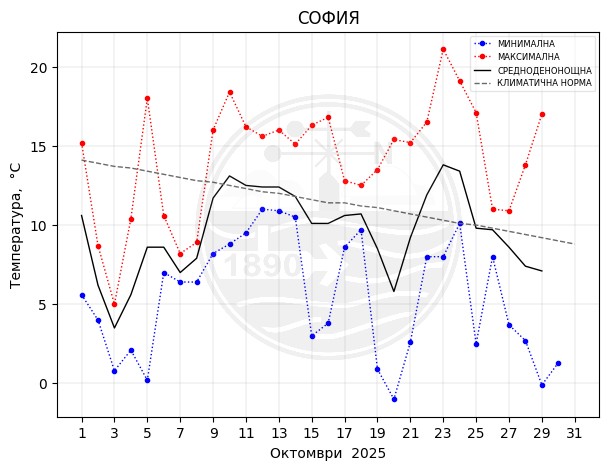
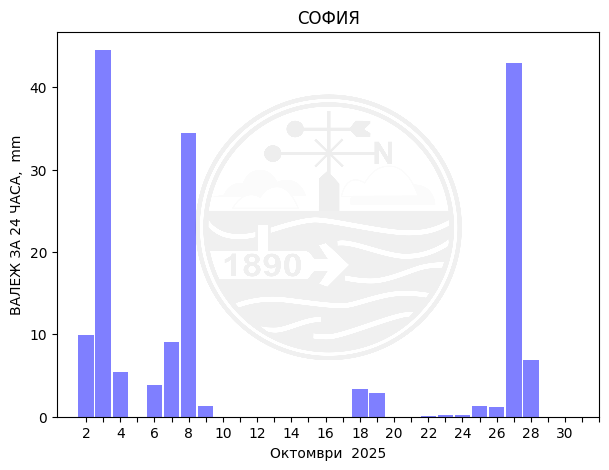
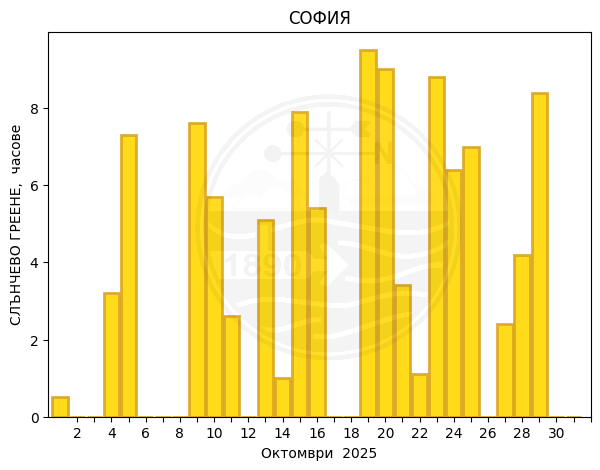
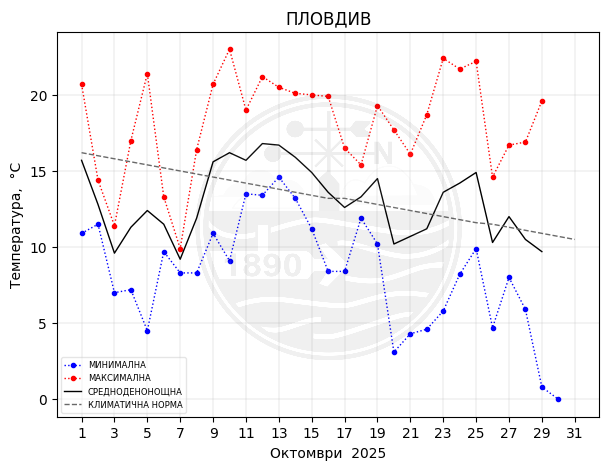
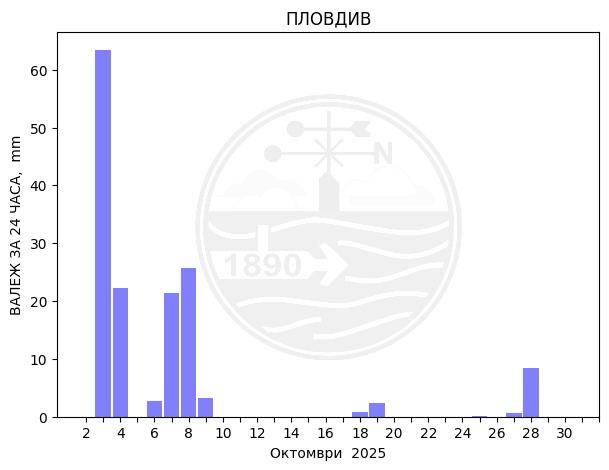
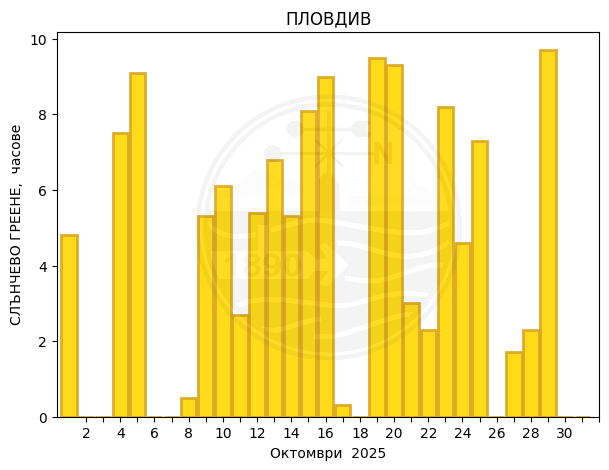
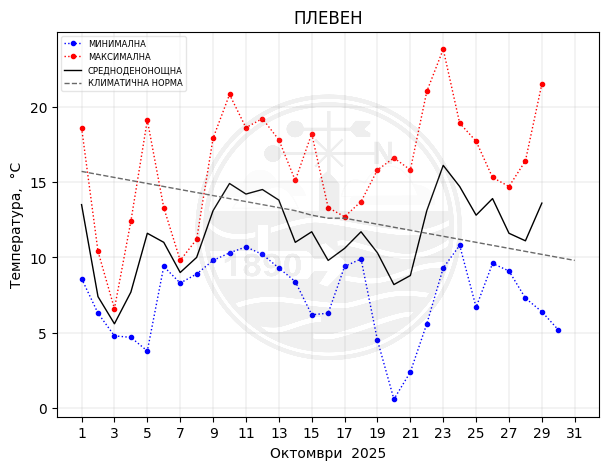
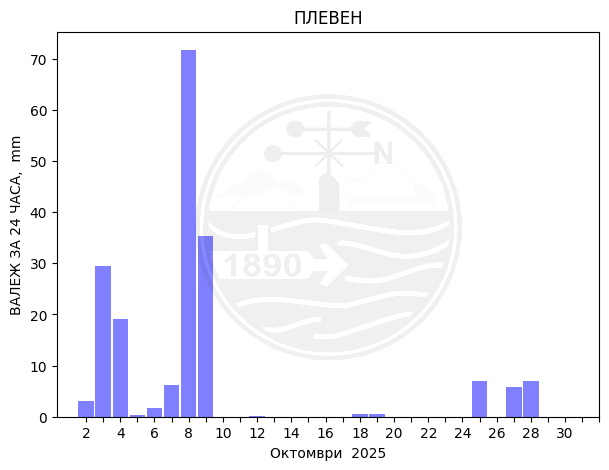
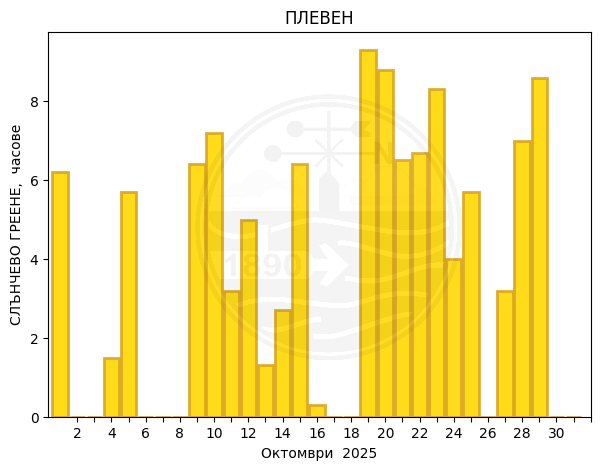
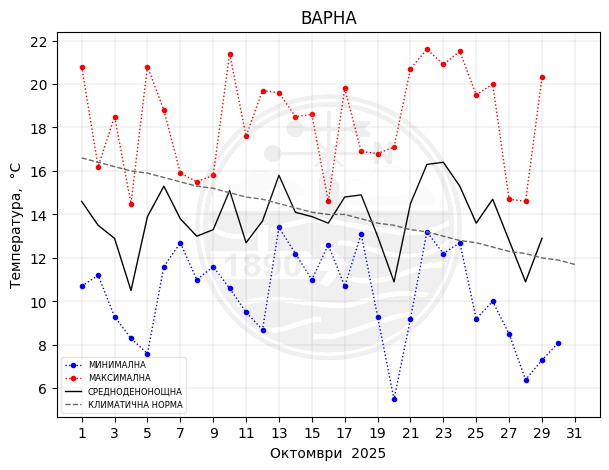
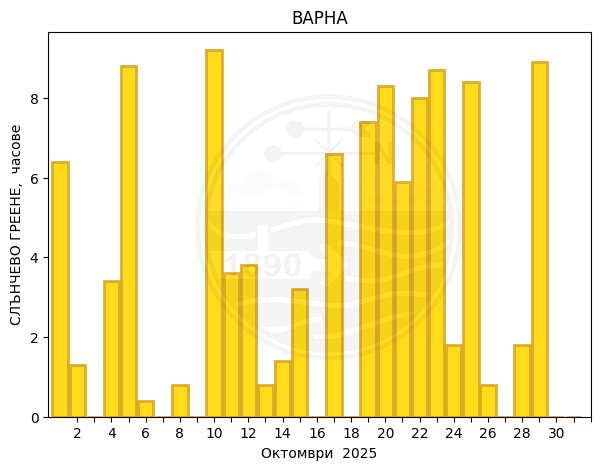
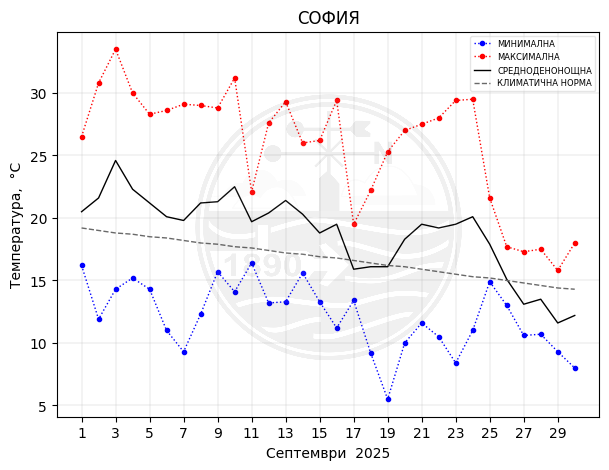
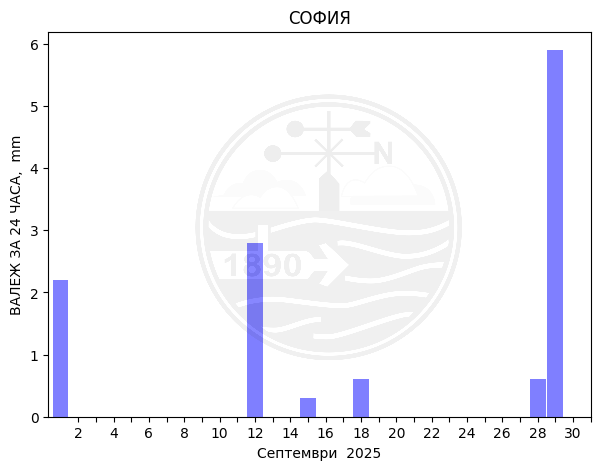
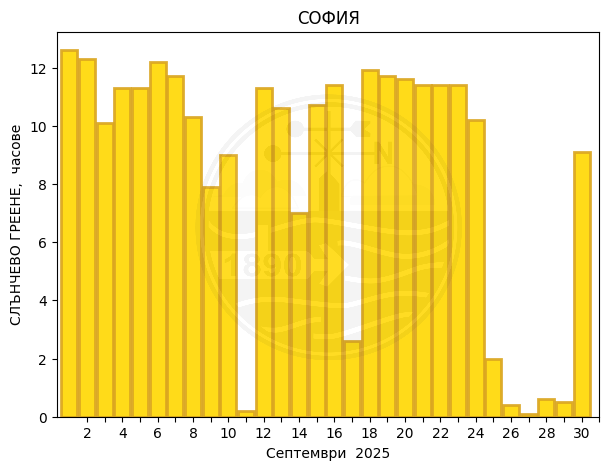
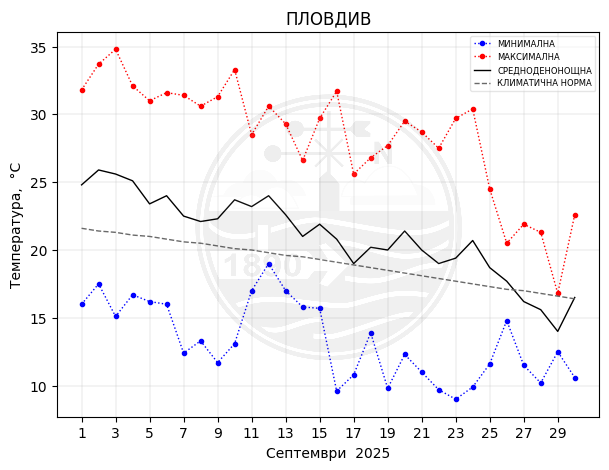
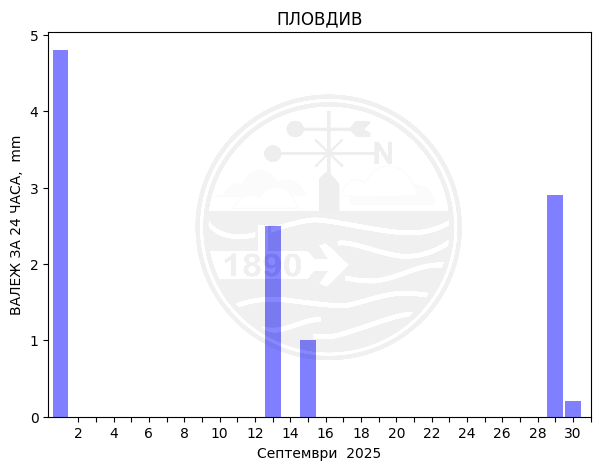
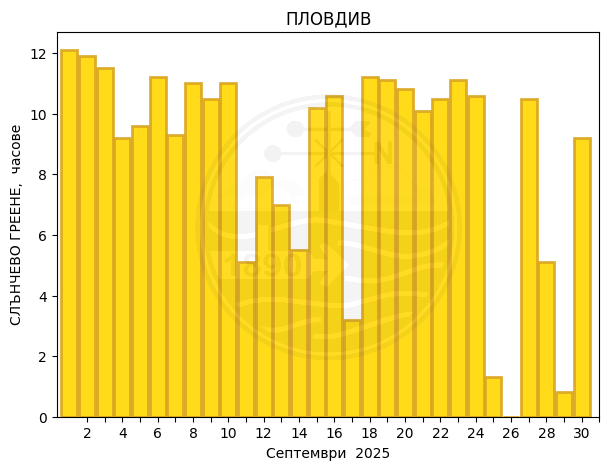
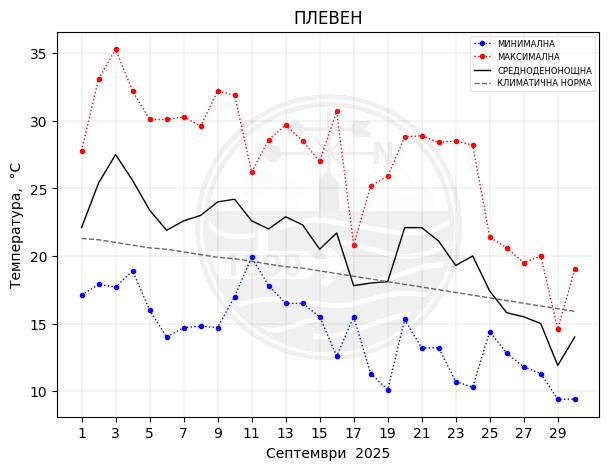
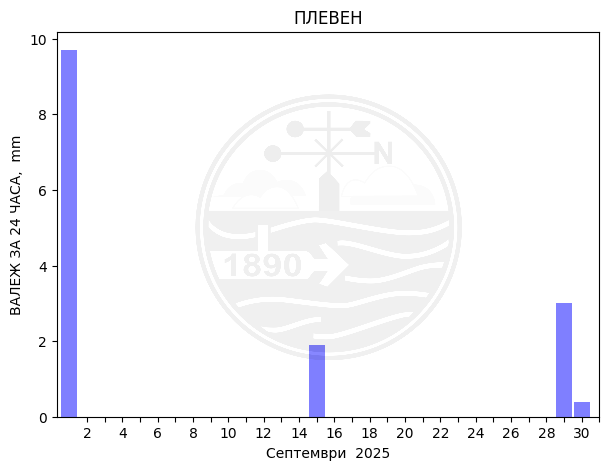
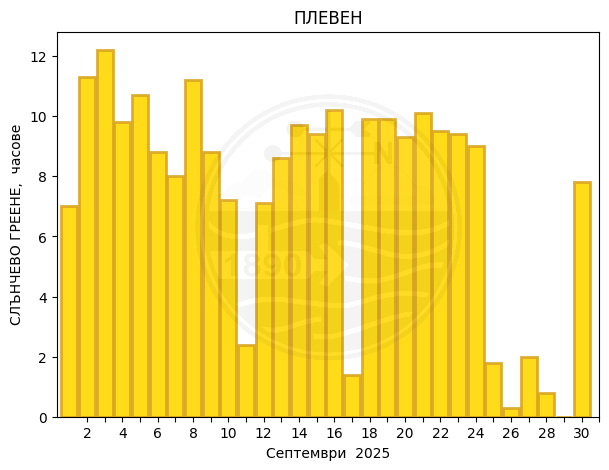
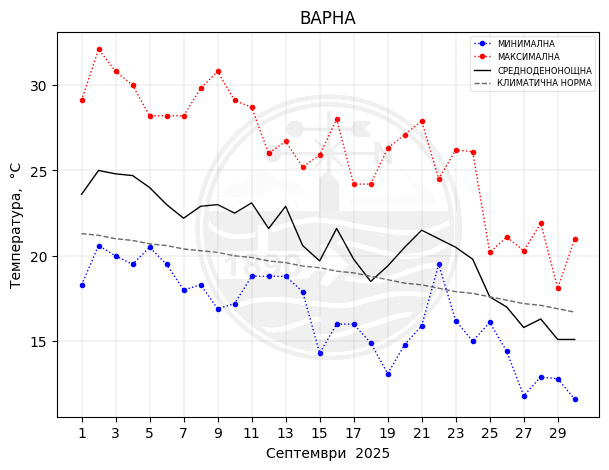
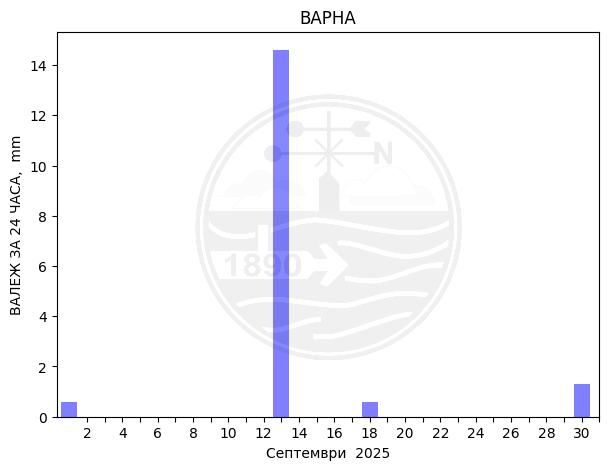
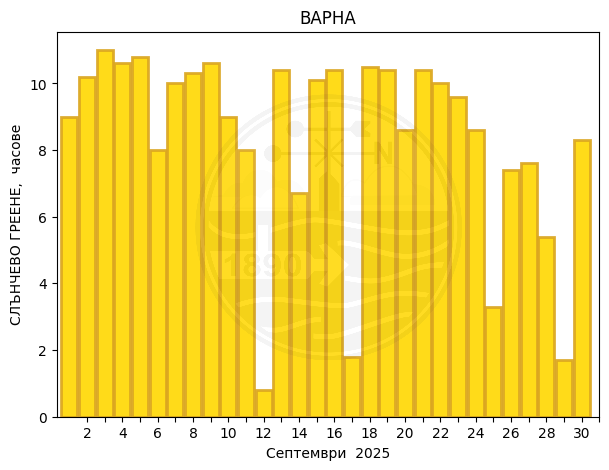
Monthly temperature, precipitation and sunlight trends
(drawn up between the 2nd and the 5th date of the month following the month to which they relate)
Sofia
Plovdiv
Pleven
Varna
Minimum and Maximum Temperatures
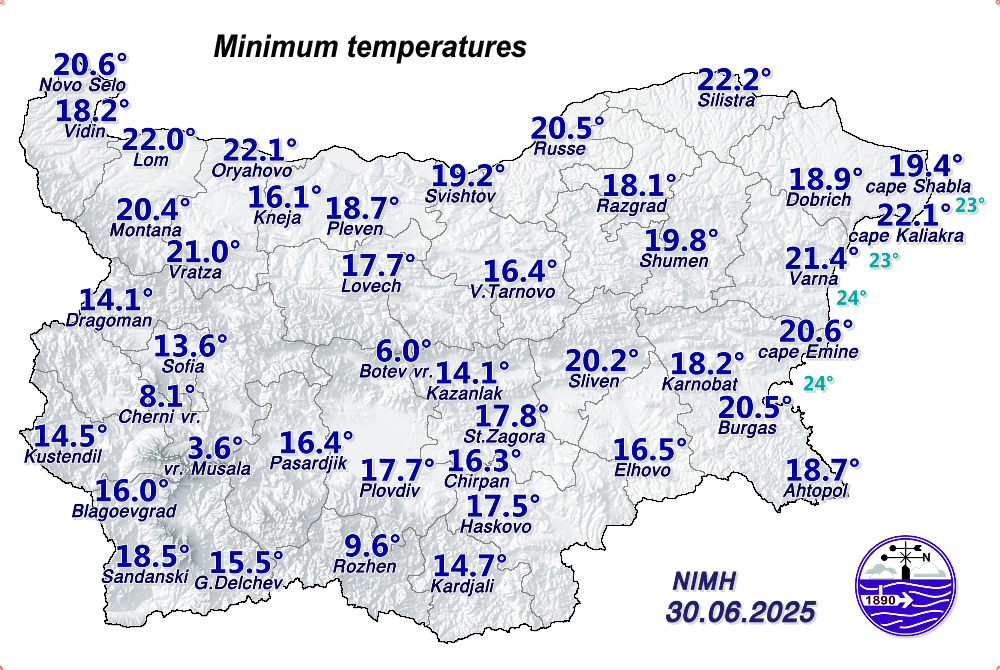
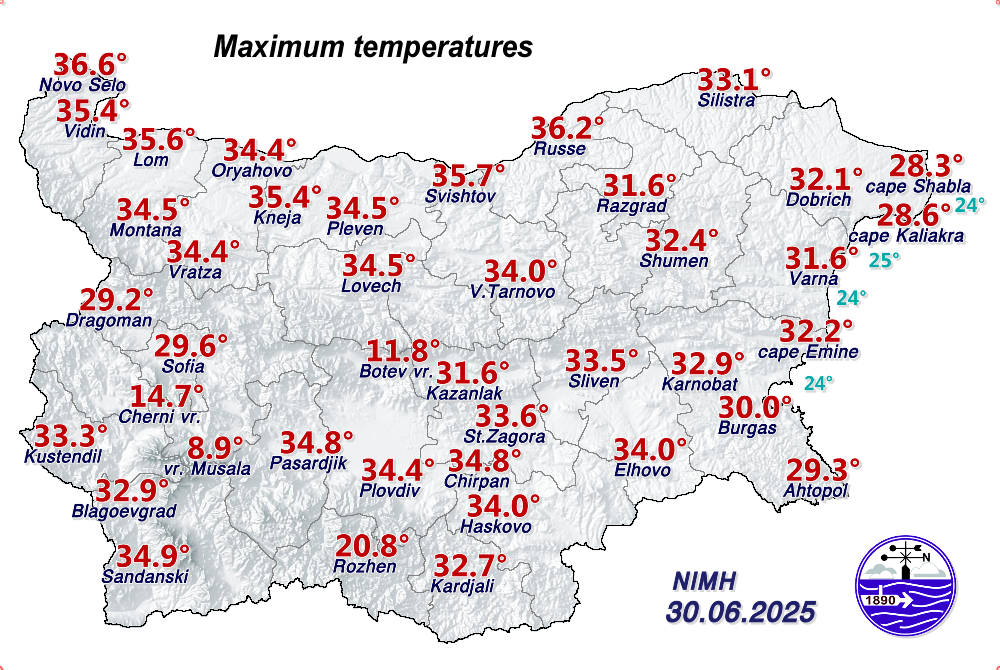
What do you see on the maps with the minimum and maximum temperatures? On the map with the minimum/maximum measured temperatures by synoptic station, you will see one value in degrees Celsius (℃) above the written name of each city that has a NIMH synoptic station. It is the minimum/maximum value recorded by the measurements in the corresponding way for that particular day. At the bottom right of the map is the date to which the corresponding temperature measurements relate.
Air temperature: air temperature is a measure of the average thermal energy of ambient air molecules—the higher the temperature, the higher the kinetic energy of the molecules. Historically, the most common instrument used was a glass thermometer with liquid that expands or contracts as a result of heating or cooling. Mercury was the most commonly used. Mercury thermometers are not used in meteorology for almost a decade, as mercury is dangerous if it leaks when the thermometer breaks. In meteorological services around the world, including the National Institute of Meteorology and Hydrology (NIMH), as part of the World Meteorological Organization (WMO), these thermometers have been replaced by those with alcohol-based liquid or digital thermometers. Modern automatic weather stations use an electronic sensor. The measurement accuracy of these sensors depends on the material from which they are made. High accuracy is achieved, for example, with sensors made of platinum. In order to measure the temperature most accurately, the instruments are placed under radiation protection - a meteorological cell of special construction so as to avoid the influence of direct heating from the Sun. The construction of the meteorological cell allows air to pass through it unhindered, it always faces north and is painted white. Combined with the compulsory positioning of the instrument cage 2 metres above the ground on a grassed mown area, avoids a maximum number of disturbances in the measurements and guarantees the reading of the actual air temperature. In NIMH, according to the standard WMO recommendations, the daily maximum (highest) and minimum (lowest) temperature are recorded once a day, at 06 UTC (08:00/09:00 - in winter/summer time in Bulgaria) and at 18 UTC (20:00/21:00 - in winter/summer time in Bulgaria), respectively, while instantaneous air temperature measurements can be made at any time of the day, practically continuously.
How is temperature measured for meteorological purposes? Temperature data before 1910 should be used with extreme caution, as many stations before that date were set up in substandard locations, some of which gave readings that were several degrees higher or lower than those measured according to post-1910 standards. Daily maximum temperatures are usually observed in the afternoon, and daily minimum temperatures at night or around dawn. In clear and calm weather, the temperature minimum is reached around sunrise. That is, the usual diurnal pattern is associated with a minimum in the morning and a maximum after noon. There are also exceptions, which are associated with certain synoptic conditions with cold intrusion, the temperatures have a so-called "reverse diurnal course", which means that it is colder in the afternoon than in the morning.
Maps-analysis of the past month and graphs of temperature and precipitation at 4 stations
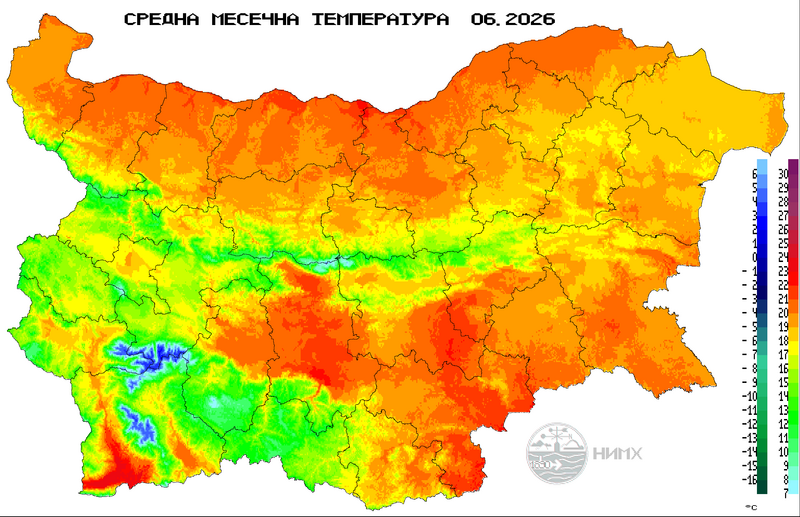
Average monthly temperature (°С), June
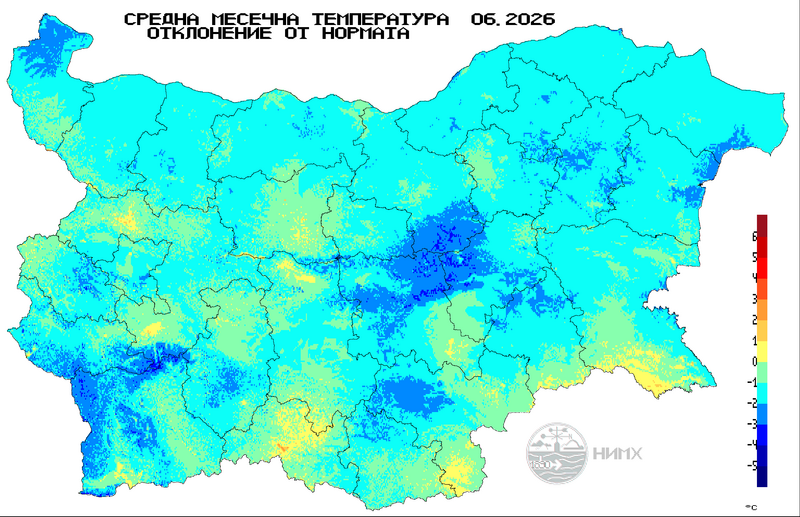
Deviation of the average monthly temperature from the climate norm (°С), June
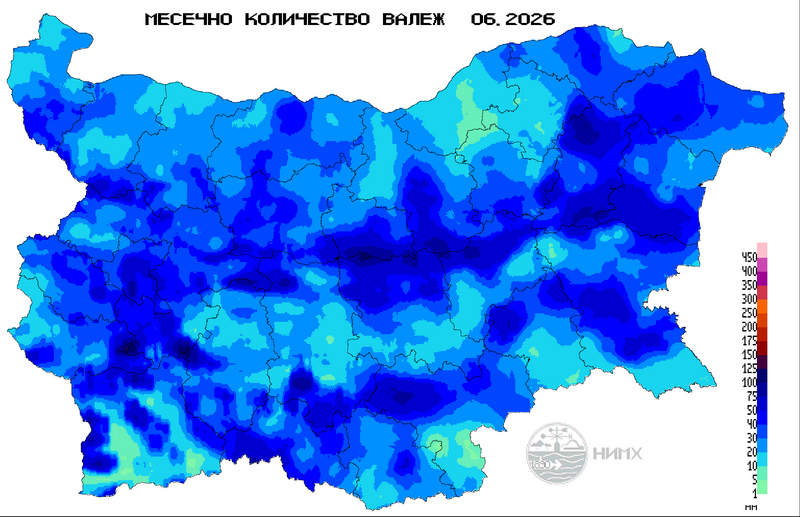
Monthly precipitation sums in mm (l/m2), June.
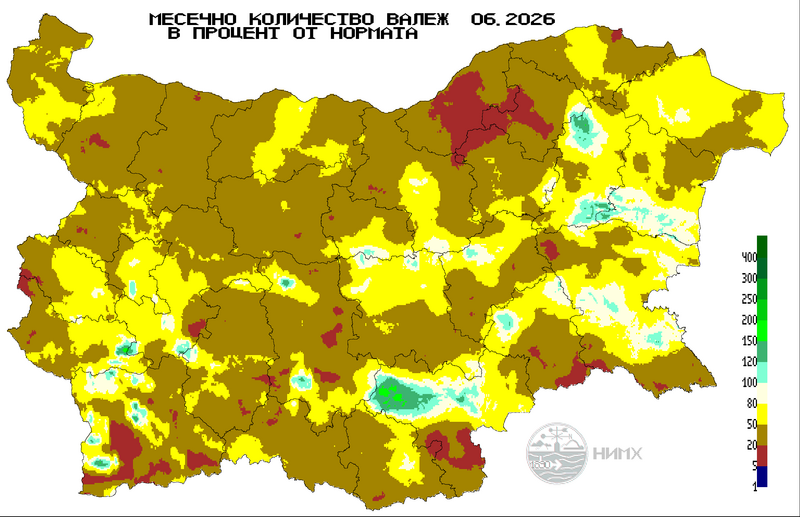
Monthly precipitation sums in % from norm,June
Monthly temperature, precipitation and sunlight trends
(drawn up between the 2nd and the 5th date of the month following the month to which they relate)
Sofia
Plovdiv
Pleven
Varna
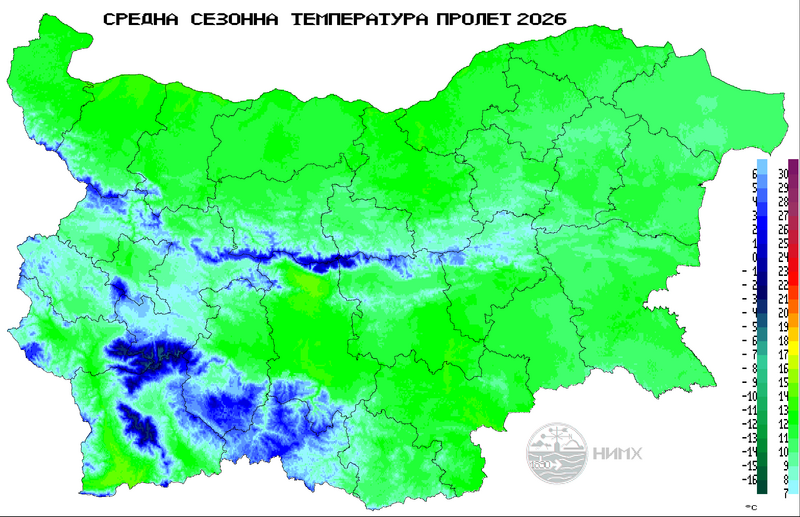
Maps-analysis of the past season
Mean seasonal temperature (°С)
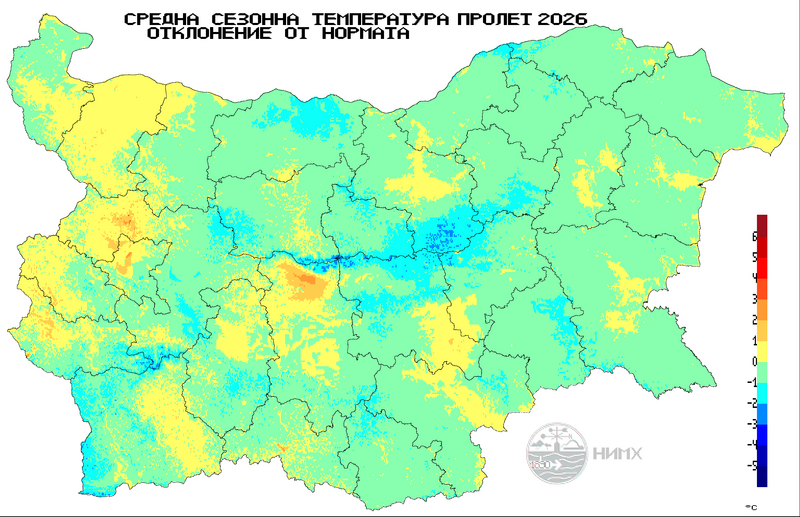
Deviation of mean seasonal temperature from norm (°С)
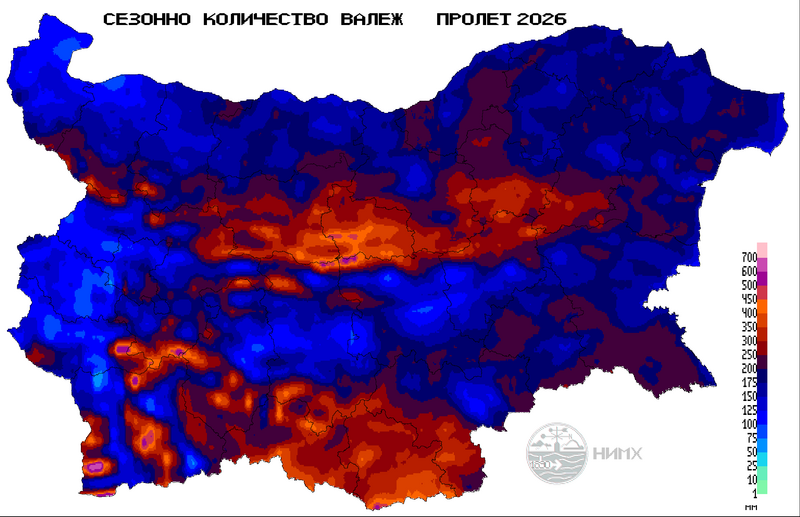
Seasonal precipitation sums in mm (l/m2)
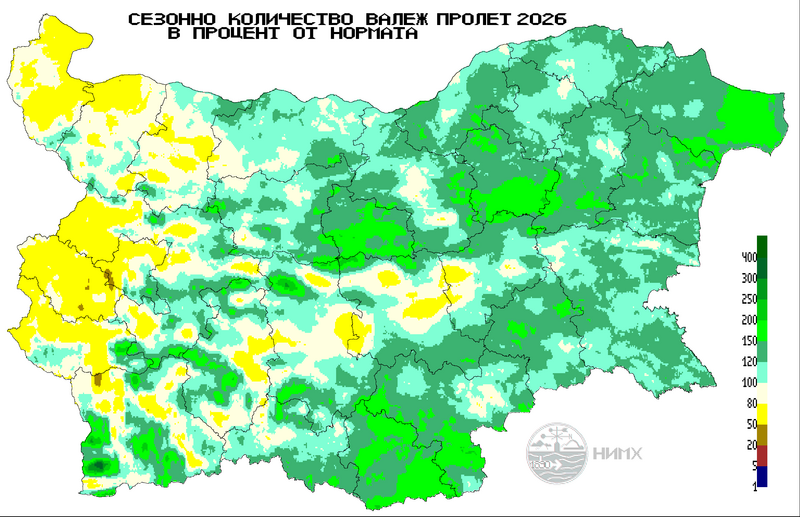
Seasonal precipitation sums in % from norm